|
SETestKCL
1.0.
|


All Classes Namespaces Files Functions Variables Typedefs Enumerations Enumerator Friends Macros Pages
|
SETestKCL
1.0.
|
#include <qcustomplot.h>
Public Types | |
| enum | LineStyle { lsNone, lsLine, lsStepLeft, lsStepRight, lsStepCenter, lsImpulse } |
| enum | ErrorType { etNone, etKey, etValue, etBoth } |
Public Member Functions | |
| QCPGraph (QCPAxis *keyAxis, QCPAxis *valueAxis) | |
| virtual | ~QCPGraph () |
| QCPDataMap * | data () const |
| LineStyle | lineStyle () const |
| QCPScatterStyle | scatterStyle () const |
| ErrorType | errorType () const |
| QPen | errorPen () const |
| double | errorBarSize () const |
| bool | errorBarSkipSymbol () const |
| QCPGraph * | channelFillGraph () const |
| bool | adaptiveSampling () const |
| void | setData (QCPDataMap *data, bool copy=false) |
| void | setData (const QVector< double > &key, const QVector< double > &value) |
| void | setDataKeyError (const QVector< double > &key, const QVector< double > &value, const QVector< double > &keyError) |
| void | setDataKeyError (const QVector< double > &key, const QVector< double > &value, const QVector< double > &keyErrorMinus, const QVector< double > &keyErrorPlus) |
| void | setDataValueError (const QVector< double > &key, const QVector< double > &value, const QVector< double > &valueError) |
| void | setDataValueError (const QVector< double > &key, const QVector< double > &value, const QVector< double > &valueErrorMinus, const QVector< double > &valueErrorPlus) |
| void | setDataBothError (const QVector< double > &key, const QVector< double > &value, const QVector< double > &keyError, const QVector< double > &valueError) |
| void | setDataBothError (const QVector< double > &key, const QVector< double > &value, const QVector< double > &keyErrorMinus, const QVector< double > &keyErrorPlus, const QVector< double > &valueErrorMinus, const QVector< double > &valueErrorPlus) |
| void | setLineStyle (LineStyle ls) |
| void | setScatterStyle (const QCPScatterStyle &style) |
| void | setErrorType (ErrorType errorType) |
| void | setErrorPen (const QPen &pen) |
| void | setErrorBarSize (double size) |
| void | setErrorBarSkipSymbol (bool enabled) |
| void | setChannelFillGraph (QCPGraph *targetGraph) |
| void | setAdaptiveSampling (bool enabled) |
| void | addData (const QCPDataMap &dataMap) |
| void | addData (const QCPData &data) |
| void | addData (double key, double value) |
| void | addData (const QVector< double > &keys, const QVector< double > &values) |
| void | removeDataBefore (double key) |
| void | removeDataAfter (double key) |
| void | removeData (double fromKey, double toKey) |
| void | removeData (double key) |
| virtual void | clearData () |
| virtual double | selectTest (const QPointF &pos, bool onlySelectable, QVariant *details=0) const |
| void | rescaleAxes (bool onlyEnlarge, bool includeErrorBars) const |
| void | rescaleKeyAxis (bool onlyEnlarge, bool includeErrorBars) const |
| void | rescaleValueAxis (bool onlyEnlarge, bool includeErrorBars) const |
 Public Member Functions inherited from QCPAbstractPlottable Public Member Functions inherited from QCPAbstractPlottable | |
| QCPAbstractPlottable (QCPAxis *keyAxis, QCPAxis *valueAxis) | |
| QString | name () const |
| bool | antialiasedFill () const |
| bool | antialiasedScatters () const |
| bool | antialiasedErrorBars () const |
| QPen | pen () const |
| QPen | selectedPen () const |
| QBrush | brush () const |
| QBrush | selectedBrush () const |
| QCPAxis * | keyAxis () const |
| QCPAxis * | valueAxis () const |
| bool | selectable () const |
| bool | selected () const |
| void | setName (const QString &name) |
| void | setAntialiasedFill (bool enabled) |
| void | setAntialiasedScatters (bool enabled) |
| void | setAntialiasedErrorBars (bool enabled) |
| void | setPen (const QPen &pen) |
| void | setSelectedPen (const QPen &pen) |
| void | setBrush (const QBrush &brush) |
| void | setSelectedBrush (const QBrush &brush) |
| void | setKeyAxis (QCPAxis *axis) |
| void | setValueAxis (QCPAxis *axis) |
| Q_SLOT void | setSelectable (bool selectable) |
| Q_SLOT void | setSelected (bool selected) |
| virtual bool | addToLegend () |
| virtual bool | removeFromLegend () const |
| void | rescaleAxes (bool onlyEnlarge=false) const |
| void | rescaleKeyAxis (bool onlyEnlarge=false) const |
| void | rescaleValueAxis (bool onlyEnlarge=false) const |
| Public Member Functions inherited from QCPLayerable | |
| QCPLayerable (QCustomPlot *plot, QString targetLayer=QString(), QCPLayerable *parentLayerable=0) | |
| ~QCPLayerable () | |
| bool | visible () const |
| QCustomPlot * | parentPlot () const |
| QCPLayerable * | parentLayerable () const |
| QCPLayer * | layer () const |
| bool | antialiased () const |
| void | setVisible (bool on) |
| Q_SLOT bool | setLayer (QCPLayer *layer) |
| bool | setLayer (const QString &layerName) |
| void | setAntialiased (bool enabled) |
| bool | realVisibility () const |
Protected Member Functions | |
| virtual void | draw (QCPPainter *painter) |
| virtual void | drawLegendIcon (QCPPainter *painter, const QRectF &rect) const |
| virtual QCPRange | getKeyRange (bool &foundRange, SignDomain inSignDomain=sdBoth) const |
| virtual QCPRange | getValueRange (bool &foundRange, SignDomain inSignDomain=sdBoth) const |
| virtual QCPRange | getKeyRange (bool &foundRange, SignDomain inSignDomain, bool includeErrors) const |
| virtual QCPRange | getValueRange (bool &foundRange, SignDomain inSignDomain, bool includeErrors) const |
| virtual void | drawFill (QCPPainter *painter, QVector< QPointF > *lineData) const |
| virtual void | drawScatterPlot (QCPPainter *painter, QVector< QCPData > *scatterData) const |
| virtual void | drawLinePlot (QCPPainter *painter, QVector< QPointF > *lineData) const |
| virtual void | drawImpulsePlot (QCPPainter *painter, QVector< QPointF > *lineData) const |
| void | getPreparedData (QVector< QCPData > *lineData, QVector< QCPData > *scatterData) const |
| void | getPlotData (QVector< QPointF > *lineData, QVector< QCPData > *scatterData) const |
| void | getScatterPlotData (QVector< QCPData > *scatterData) const |
| void | getLinePlotData (QVector< QPointF > *linePixelData, QVector< QCPData > *scatterData) const |
| void | getStepLeftPlotData (QVector< QPointF > *linePixelData, QVector< QCPData > *scatterData) const |
| void | getStepRightPlotData (QVector< QPointF > *linePixelData, QVector< QCPData > *scatterData) const |
| void | getStepCenterPlotData (QVector< QPointF > *linePixelData, QVector< QCPData > *scatterData) const |
| void | getImpulsePlotData (QVector< QPointF > *linePixelData, QVector< QCPData > *scatterData) const |
| void | drawError (QCPPainter *painter, double x, double y, const QCPData &data) const |
| void | getVisibleDataBounds (QCPDataMap::const_iterator &lower, QCPDataMap::const_iterator &upper) const |
| int | countDataInBounds (const QCPDataMap::const_iterator &lower, const QCPDataMap::const_iterator &upper, int maxCount) const |
| void | addFillBasePoints (QVector< QPointF > *lineData) const |
| void | removeFillBasePoints (QVector< QPointF > *lineData) const |
| QPointF | lowerFillBasePoint (double lowerKey) const |
| QPointF | upperFillBasePoint (double upperKey) const |
| const QPolygonF | getChannelFillPolygon (const QVector< QPointF > *lineData) const |
| int | findIndexBelowX (const QVector< QPointF > *data, double x) const |
| int | findIndexAboveX (const QVector< QPointF > *data, double x) const |
| int | findIndexBelowY (const QVector< QPointF > *data, double y) const |
| int | findIndexAboveY (const QVector< QPointF > *data, double y) const |
| double | pointDistance (const QPointF &pixelPoint) const |
| Protected Member Functions inherited from QCPAbstractPlottable | |
| virtual QRect | clipRect () const |
| virtual QCP::Interaction | selectionCategory () const |
| void | applyDefaultAntialiasingHint (QCPPainter *painter) const |
| virtual void | selectEvent (QMouseEvent *event, bool additive, const QVariant &details, bool *selectionStateChanged) |
| virtual void | deselectEvent (bool *selectionStateChanged) |
| void | coordsToPixels (double key, double value, double &x, double &y) const |
| const QPointF | coordsToPixels (double key, double value) const |
| void | pixelsToCoords (double x, double y, double &key, double &value) const |
| void | pixelsToCoords (const QPointF &pixelPos, double &key, double &value) const |
| QPen | mainPen () const |
| QBrush | mainBrush () const |
| void | applyFillAntialiasingHint (QCPPainter *painter) const |
| void | applyScattersAntialiasingHint (QCPPainter *painter) const |
| void | applyErrorBarsAntialiasingHint (QCPPainter *painter) const |
| double | distSqrToLine (const QPointF &start, const QPointF &end, const QPointF &point) const |
| Protected Member Functions inherited from QCPLayerable | |
| virtual void | parentPlotInitialized (QCustomPlot *parentPlot) |
| void | initializeParentPlot (QCustomPlot *parentPlot) |
| void | setParentLayerable (QCPLayerable *parentLayerable) |
| bool | moveToLayer (QCPLayer *layer, bool prepend) |
| void | applyAntialiasingHint (QCPPainter *painter, bool localAntialiased, QCP::AntialiasedElement overrideElement) const |
Protected Attributes | |
| QCPDataMap * | mData |
| QPen | mErrorPen |
| LineStyle | mLineStyle |
| QCPScatterStyle | mScatterStyle |
| ErrorType | mErrorType |
| double | mErrorBarSize |
| bool | mErrorBarSkipSymbol |
| QPointer< QCPGraph > | mChannelFillGraph |
| bool | mAdaptiveSampling |
| Protected Attributes inherited from QCPAbstractPlottable | |
| QString | mName |
| bool | mAntialiasedFill |
| bool | mAntialiasedScatters |
| bool | mAntialiasedErrorBars |
| QPen | mPen |
| QPen | mSelectedPen |
| QBrush | mBrush |
| QBrush | mSelectedBrush |
| QPointer< QCPAxis > | mKeyAxis |
| QPointer< QCPAxis > | mValueAxis |
| bool | mSelectable |
| bool | mSelected |
| Protected Attributes inherited from QCPLayerable | |
| bool | mVisible |
| QCustomPlot * | mParentPlot |
| QPointer< QCPLayerable > | mParentLayerable |
| QCPLayer * | mLayer |
| bool | mAntialiased |
Friends | |
| class | QCustomPlot |
| class | QCPLegend |
Additional Inherited Members | |
| Signals inherited from QCPAbstractPlottable | |
| void | selectionChanged (bool selected) |
| void | selectableChanged (bool selectable) |
| Signals inherited from QCPLayerable | |
| void | layerChanged (QCPLayer *newLayer) |
| Protected Types inherited from QCPAbstractPlottable | |
| enum | SignDomain { sdNegative, sdBoth, sdPositive } |
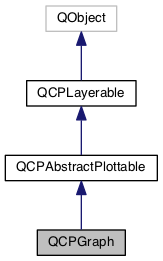
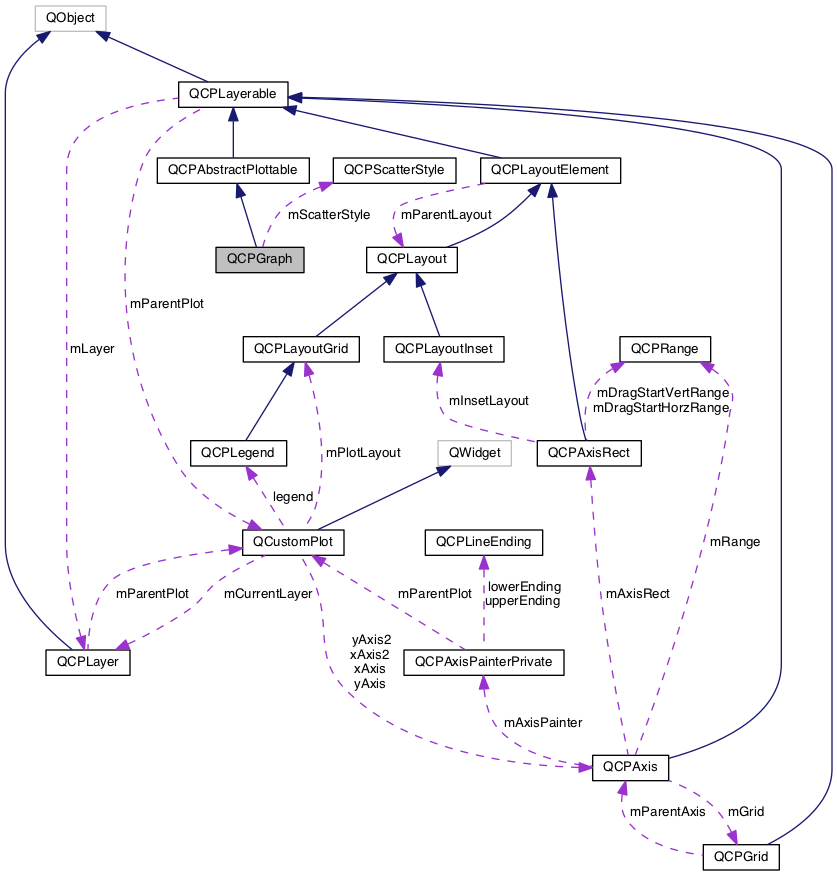
A plottable representing a graph in a plot.

Usually you create new graphs by calling QCustomPlot::addGraph. The resulting instance can be accessed via QCustomPlot::graph.
To plot data, assign it with the setData or addData functions. Alternatively, you can also access and modify the graph's data via the data method, which returns a pointer to the internal QCPDataMap.
Graphs are used to display single-valued data. Single-valued means that there should only be one data point per unique key coordinate. In other words, the graph can't have loops. If you do want to plot non-single-valued curves, rather use the QCPCurve plottable.
Gaps in the graph line can be created by adding data points with NaN as value (qQNaN() or std::numeric_limits<double>::quiet_NaN()) in between the two data points that shall be separated.
The appearance of the graph is mainly determined by the line style, scatter style, brush and pen of the graph (setLineStyle, setScatterStyle, setBrush, setPen).
QCPGraph knows two types of fills: Normal graph fills towards the zero-value-line parallel to the key axis of the graph, and fills between two graphs, called channel fills. To enable a fill, just set a brush with setBrush which is neither Qt::NoBrush nor fully transparent.
By default, a normal fill towards the zero-value-line will be drawn. To set up a channel fill between this graph and another one, call setChannelFillGraph with the other graph as parameter.
Definition at line 2490 of file qcustomplot.h.
| enum ErrorType |
Defines what kind of error bars are drawn for each data point
Definition at line 2521 of file qcustomplot.h.
| enum LineStyle |
Defines how the graph's line is represented visually in the plot. The line is drawn with the current pen of the graph (setPen).
| Enumerator | |
|---|---|
| lsNone |
data points are not connected with any lines (e.g. data only represented with symbols according to the scatter style, see setScatterStyle) |
| lsLine |
data points are connected by a straight line |
| lsStepLeft |
line is drawn as steps where the step height is the value of the left data point |
| lsStepRight |
line is drawn as steps where the step height is the value of the right data point |
| lsStepCenter |
line is drawn as steps where the step is in between two data points |
| lsImpulse |
each data point is represented by a line parallel to the value axis, which reaches from the data point to the zero-value-line |
Definition at line 2509 of file qcustomplot.h.
Constructs a graph which uses keyAxis as its key axis ("x") and valueAxis as its value axis ("y"). keyAxis and valueAxis must reside in the same QCustomPlot instance and not have the same orientation. If either of these restrictions is violated, a corresponding message is printed to the debug output (qDebug), the construction is not aborted, though.
The constructed QCPGraph can be added to the plot with QCustomPlot::addPlottable, QCustomPlot then takes ownership of the graph.
To directly create a graph inside a plot, you can also use the simpler QCustomPlot::addGraph function.
Definition at line 14483 of file qcustomplot.cpp.
References etNone, lsLine, mData, setAdaptiveSampling(), QCPAbstractPlottable::setBrush(), setChannelFillGraph(), setErrorBarSize(), setErrorBarSkipSymbol(), setErrorPen(), setErrorType(), setLineStyle(), QCPAbstractPlottable::setPen(), QCPAbstractPlottable::setSelectedBrush(), and QCPAbstractPlottable::setSelectedPen().
|
virtual |
Definition at line 14502 of file qcustomplot.cpp.
References mData.
|
inline |
Definition at line 2540 of file qcustomplot.h.
| void addData | ( | const QCPDataMap & | dataMap | ) |
Adds the provided data points in dataMap to the current data.
Alternatively, you can also access and modify the graph's data via the data method, which returns a pointer to the internal QCPDataMap.
Definition at line 14862 of file qcustomplot.cpp.
References mData.
| void addData | ( | const QCPData & | data | ) |
This is an overloaded member function, provided for convenience. It differs from the above function only in what argument(s) it accepts. Adds the provided single data point in data to the current data.
Alternatively, you can also access and modify the graph's data via the data method, which returns a pointer to the internal QCPDataMap.
Definition at line 14875 of file qcustomplot.cpp.
References QCPData::key, and mData.
| void addData | ( | double | key, |
| double | value | ||
| ) |
This is an overloaded member function, provided for convenience. It differs from the above function only in what argument(s) it accepts. Adds the provided single data point as key and value pair to the current data.
Alternatively, you can also access and modify the graph's data via the data method, which returns a pointer to the internal QCPDataMap.
Definition at line 14888 of file qcustomplot.cpp.
References QCPData::key, mData, and QCPData::value.
| void addData | ( | const QVector< double > & | keys, |
| const QVector< double > & | values | ||
| ) |
This is an overloaded member function, provided for convenience. It differs from the above function only in what argument(s) it accepts. Adds the provided data points as key and value pairs to the current data.
Alternatively, you can also access and modify the graph's data via the data method, which returns a pointer to the internal QCPDataMap.
Definition at line 14904 of file qcustomplot.cpp.
References QCPData::key, and mData.
|
protected |
Definition at line 16019 of file qcustomplot.cpp.
References lowerFillBasePoint(), QCPAbstractPlottable::mKeyAxis, and upperFillBasePoint().
Referenced by drawFill().
|
inline |
Definition at line 2539 of file qcustomplot.h.
References data().
|
virtual |
Removes all data points.
Implements QCPAbstractPlottable.
Definition at line 14972 of file qcustomplot.cpp.
References mData.
|
protected |
Definition at line 15990 of file qcustomplot.cpp.
References mData.
Referenced by getPreparedData().
|
inline |
Returns a pointer to the internal data storage of type QCPDataMap. You may use it to directly manipulate the data, which may be more convenient and faster than using the regular setData or addData methods, in certain situations.
Definition at line 2532 of file qcustomplot.h.
Referenced by channelFillGraph(), setData(), and QCPItemTracer::updatePosition().
|
protectedvirtual |
Implements QCPAbstractPlottable.
Definition at line 15077 of file qcustomplot.cpp.
References drawFill(), drawImpulsePlot(), drawLinePlot(), drawScatterPlot(), getPlotData(), QCP::isInvalidData(), QCPScatterStyle::isNone(), lsImpulse, lsNone, mData, QCPAbstractPlottable::mKeyAxis, mLineStyle, mScatterStyle, QCPAbstractPlottable::mValueAxis, and QCPAbstractPlottable::name().
|
protected |
Definition at line 15849 of file qcustomplot.cpp.
References QCPAxis::coordToPixel(), QCPPainter::drawLine(), etBoth, etKey, etValue, QCPData::key, QCPAbstractPlottable::keyAxis(), QCPData::keyErrorMinus, QCPData::keyErrorPlus, mErrorBarSize, mErrorBarSkipSymbol, mErrorType, QCPAbstractPlottable::mKeyAxis, mScatterStyle, QCPAbstractPlottable::mValueAxis, QCPAxis::orientation(), QCPAxis::rangeReversed(), QCPScatterStyle::size(), QCPData::value, QCPAbstractPlottable::valueAxis(), QCPData::valueErrorMinus, and QCPData::valueErrorPlus.
Referenced by drawScatterPlot().
|
protectedvirtual |
Definition at line 15481 of file qcustomplot.cpp.
References addFillBasePoints(), QCPAbstractPlottable::applyFillAntialiasingHint(), getChannelFillPolygon(), lsImpulse, QCPAbstractPlottable::mainBrush(), mChannelFillGraph, mLineStyle, removeFillBasePoints(), and QCPPainter::setPen().
Referenced by draw().
|
protectedvirtual |
Definition at line 15635 of file qcustomplot.cpp.
References QCPAbstractPlottable::applyDefaultAntialiasingHint(), QCPAbstractPlottable::mainPen(), QCPAbstractPlottable::pen(), and QCPPainter::setPen().
Referenced by draw().
|
protectedvirtual |
Implements QCPAbstractPlottable.
Definition at line 15125 of file qcustomplot.cpp.
References QCPAbstractPlottable::applyDefaultAntialiasingHint(), QCPAbstractPlottable::applyFillAntialiasingHint(), QCPAbstractPlottable::applyScattersAntialiasingHint(), QCPScatterStyle::applyTo(), QCPPainter::drawLine(), QCPScatterStyle::drawShape(), QCPScatterStyle::isNone(), lsNone, QCPAbstractPlottable::mBrush, mLineStyle, QCPAbstractPlottable::mPen, mScatterStyle, QCPScatterStyle::pixmap(), QCPPainter::setPen(), QCPScatterStyle::setPixmap(), QCPScatterStyle::shape(), and QCPScatterStyle::ssPixmap.
|
protectedvirtual |
Definition at line 15560 of file qcustomplot.cpp.
References QCPAbstractPlottable::applyDefaultAntialiasingHint(), QCPPainter::drawLine(), QCPAbstractPlottable::mainPen(), QCPPainter::modes(), QCPLayerable::mParentPlot, QCP::phFastPolylines, QCustomPlot::plottingHints(), QCPPainter::pmNoCaching, QCPPainter::pmVectorized, and QCPPainter::setPen().
Referenced by draw().
|
protectedvirtual |
Definition at line 15513 of file qcustomplot.cpp.
References QCPAbstractPlottable::applyErrorBarsAntialiasingHint(), QCPAbstractPlottable::applyScattersAntialiasingHint(), QCPScatterStyle::applyTo(), QCPAxis::coordToPixel(), drawError(), QCPScatterStyle::drawShape(), etNone, QCPAbstractPlottable::keyAxis(), mErrorPen, mErrorType, QCPAbstractPlottable::mKeyAxis, QCPAbstractPlottable::mPen, mScatterStyle, QCPAbstractPlottable::mValueAxis, QCPAxis::orientation(), QCPPainter::setPen(), and QCPAbstractPlottable::valueAxis().
Referenced by draw().
|
inline |
Definition at line 2537 of file qcustomplot.h.
|
inline |
Definition at line 2538 of file qcustomplot.h.
|
inline |
Definition at line 2536 of file qcustomplot.h.
|
inline |
Definition at line 2535 of file qcustomplot.h.
Referenced by setErrorType().
|
protected |
Definition at line 16332 of file qcustomplot.cpp.
Referenced by getChannelFillPolygon().
|
protected |
Definition at line 16376 of file qcustomplot.cpp.
Referenced by getChannelFillPolygon().
|
protected |
Definition at line 16354 of file qcustomplot.cpp.
Referenced by getChannelFillPolygon().
|
protected |
Definition at line 16469 of file qcustomplot.cpp.
Referenced by getChannelFillPolygon().
|
protected |
Definition at line 16190 of file qcustomplot.cpp.
References findIndexAboveX(), findIndexAboveY(), findIndexBelowX(), findIndexBelowY(), QCPAbstractPlottable::keyAxis(), mChannelFillGraph, QCPAbstractPlottable::mKeyAxis, QCPAbstractPlottable::mValueAxis, QCPAxis::orientation(), and QCPAbstractPlottable::valueAxis().
Referenced by drawFill().
|
protected |
Definition at line 15429 of file qcustomplot.cpp.
References QCPAxis::coordToPixel(), getPreparedData(), QCPAbstractPlottable::keyAxis(), QCPAbstractPlottable::mKeyAxis, QCPAbstractPlottable::mValueAxis, QCPAxis::orientation(), and QCPAbstractPlottable::valueAxis().
Referenced by getPlotData().
|
protectedvirtual |
Implements QCPAbstractPlottable.
Definition at line 16485 of file qcustomplot.cpp.
Referenced by rescaleKeyAxis().
|
protectedvirtual |
This is an overloaded member function, provided for convenience. It differs from the above function only in what argument(s) it accepts.
Allows to specify whether the error bars should be included in the range calculation.
Definition at line 16506 of file qcustomplot.cpp.
References QCPRange::lower, mData, QCPAbstractPlottable::sdBoth, QCPAbstractPlottable::sdNegative, QCPAbstractPlottable::sdPositive, and QCPRange::upper.
|
protected |
Definition at line 15217 of file qcustomplot.cpp.
References QCPAxis::coordToPixel(), getPreparedData(), QCPAbstractPlottable::keyAxis(), QCPAbstractPlottable::mKeyAxis, QCPAbstractPlottable::mValueAxis, QCPAxis::orientation(), and QCPAbstractPlottable::valueAxis().
Referenced by getPlotData().
|
protected |
Definition at line 15177 of file qcustomplot.cpp.
References getImpulsePlotData(), getLinePlotData(), getScatterPlotData(), getStepCenterPlotData(), getStepLeftPlotData(), getStepRightPlotData(), lsImpulse, lsLine, lsNone, lsStepCenter, lsStepLeft, lsStepRight, and mLineStyle.
Referenced by draw(), and pointDistance().
|
protected |
Definition at line 15661 of file qcustomplot.cpp.
References QCPAxis::coordToPixel(), countDataInBounds(), getVisibleDataBounds(), QCPAbstractPlottable::keyAxis(), QCPRange::lower, mAdaptiveSampling, mData, QCPAbstractPlottable::mKeyAxis, QCPAbstractPlottable::mValueAxis, QCPAxis::orientation(), QCPAxis::pixelToCoord(), QCPAxis::range(), QCPAxis::rangeReversed(), QCPAxis::scaleType(), QCPAxis::stLogarithmic, QCPRange::upper, and QCPAbstractPlottable::valueAxis().
Referenced by getImpulsePlotData(), getLinePlotData(), getScatterPlotData(), getStepCenterPlotData(), getStepLeftPlotData(), and getStepRightPlotData().
|
protected |
Definition at line 15201 of file qcustomplot.cpp.
References getPreparedData().
Referenced by getPlotData(), and pointDistance().
|
protected |
Definition at line 15364 of file qcustomplot.cpp.
References QCPAxis::coordToPixel(), getPreparedData(), QCPAbstractPlottable::keyAxis(), QCPAbstractPlottable::mKeyAxis, QCPAbstractPlottable::mValueAxis, QCPAxis::orientation(), and QCPAbstractPlottable::valueAxis().
Referenced by getPlotData().
|
protected |
Definition at line 15258 of file qcustomplot.cpp.
References QCPAxis::coordToPixel(), getPreparedData(), QCPAbstractPlottable::keyAxis(), QCPAbstractPlottable::mKeyAxis, QCPAbstractPlottable::mValueAxis, QCPAxis::orientation(), and QCPAbstractPlottable::valueAxis().
Referenced by getPlotData().
|
protected |
Definition at line 15311 of file qcustomplot.cpp.
References QCPAxis::coordToPixel(), getPreparedData(), QCPAbstractPlottable::keyAxis(), QCPAbstractPlottable::mKeyAxis, QCPAbstractPlottable::mValueAxis, QCPAxis::orientation(), and QCPAbstractPlottable::valueAxis().
Referenced by getPlotData().
|
protectedvirtual |
Implements QCPAbstractPlottable.
Definition at line 16493 of file qcustomplot.cpp.
Referenced by rescaleValueAxis().
|
protectedvirtual |
This is an overloaded member function, provided for convenience. It differs from the above function only in what argument(s) it accepts.
Allows to specify whether the error bars should be included in the range calculation.
Definition at line 16621 of file qcustomplot.cpp.
References QCPRange::lower, mData, QCPAbstractPlottable::sdBoth, QCPAbstractPlottable::sdNegative, QCPAbstractPlottable::sdPositive, and QCPRange::upper.
|
protected |
Definition at line 15960 of file qcustomplot.cpp.
References mData, and QCPAbstractPlottable::mKeyAxis.
Referenced by getPreparedData().
|
inline |
Definition at line 2533 of file qcustomplot.h.
|
protected |
Definition at line 16065 of file qcustomplot.cpp.
References QCPAxis::atBottom, QCPAxis::atLeft, QCPAxis::atRight, QCPAxis::atTop, QCPAxis::axisRect(), QCPAxis::axisType(), QCPAxisRect::bottom(), QCPAxis::coordToPixel(), QCPAbstractPlottable::keyAxis(), QCPAxisRect::left(), QCPAbstractPlottable::mKeyAxis, QCPAbstractPlottable::mValueAxis, QCPAxis::orientation(), QCPAxis::range(), QCPAxis::rangeReversed(), QCPAxisRect::right(), QCPAxis::scaleType(), QCPAxis::stLinear, QCPAxisRect::top(), QCPRange::upper, and QCPAbstractPlottable::valueAxis().
Referenced by addFillBasePoints().
|
protected |
Definition at line 16400 of file qcustomplot.cpp.
References QCPAbstractPlottable::coordsToPixels(), QCPAbstractPlottable::distSqrToLine(), getPlotData(), getScatterPlotData(), QCPScatterStyle::isNone(), lsImpulse, lsNone, mData, mLineStyle, and mScatterStyle.
Referenced by selectTest().
| void removeData | ( | double | fromKey, |
| double | toKey | ||
| ) |
Removes all data points with keys between fromKey and toKey. if fromKey is greater or equal to toKey, the function does nothing. To remove a single data point with known key, use removeData(double key).
Definition at line 14946 of file qcustomplot.cpp.
References mData.
| void removeData | ( | double | key | ) |
This is an overloaded member function, provided for convenience. It differs from the above function only in what argument(s) it accepts.
Removes a single data point at key. If the position is not known with absolute precision, consider using removeData(double fromKey, double toKey) with a small fuzziness interval around the suspected position, depeding on the precision with which the key is known.
Definition at line 14963 of file qcustomplot.cpp.
References mData.
| void removeDataAfter | ( | double | key | ) |
Removes all data points with keys greater than key.
Definition at line 14931 of file qcustomplot.cpp.
References mData.
| void removeDataBefore | ( | double | key | ) |
Removes all data points with keys smaller than key.
Definition at line 14920 of file qcustomplot.cpp.
References mData.
|
protected |
Definition at line 16043 of file qcustomplot.cpp.
Referenced by drawFill().
| void rescaleAxes | ( | bool | onlyEnlarge, |
| bool | includeErrorBars | ||
| ) | const |
This is an overloaded member function, provided for convenience. It differs from the above function only in what argument(s) it accepts.
Allows to define whether error bars are taken into consideration when determining the new axis range.
Definition at line 14998 of file qcustomplot.cpp.
References rescaleKeyAxis(), and rescaleValueAxis().
Referenced by MainWindow::UpdateSummary().
| void rescaleKeyAxis | ( | bool | onlyEnlarge, |
| bool | includeErrorBars | ||
| ) | const |
This is an overloaded member function, provided for convenience. It differs from the above function only in what argument(s) it accepts.
Allows to define whether error bars (of kind QCPGraph::etKey) are taken into consideration when determining the new axis range.
Definition at line 15011 of file qcustomplot.cpp.
References getKeyRange(), QCPAbstractPlottable::keyAxis(), QCPRange::lower, mData, QCPAbstractPlottable::mKeyAxis, QCPAxis::range(), QCPAxis::scaleType(), QCPAbstractPlottable::sdBoth, QCPAbstractPlottable::sdNegative, QCPAbstractPlottable::sdPositive, QCPAxis::setRange(), QCPAxis::stLogarithmic, and QCPRange::upper.
Referenced by rescaleAxes().
| void rescaleValueAxis | ( | bool | onlyEnlarge, |
| bool | includeErrorBars | ||
| ) | const |
This is an overloaded member function, provided for convenience. It differs from the above function only in what argument(s) it accepts.
Allows to define whether error bars (of kind QCPGraph::etValue) are taken into consideration when determining the new axis range.
Definition at line 15047 of file qcustomplot.cpp.
References getValueRange(), QCPRange::lower, mData, QCPAbstractPlottable::mValueAxis, QCPAxis::range(), QCPAxis::scaleType(), QCPAbstractPlottable::sdBoth, QCPAbstractPlottable::sdNegative, QCPAbstractPlottable::sdPositive, QCPAxis::setRange(), QCPAxis::stLogarithmic, QCPRange::upper, and QCPAbstractPlottable::valueAxis().
Referenced by rescaleAxes().
|
inline |
Definition at line 2534 of file qcustomplot.h.
|
virtual |
This function is used to decide whether a click hits a layerable object or not.
pos is a point in pixel coordinates on the QCustomPlot surface. This function returns the shortest pixel distance of this point to the object. If the object is either invisible or the distance couldn't be determined, -1.0 is returned. Further, if onlySelectable is true and the object is not selectable, -1.0 is returned, too.
If the object is represented not by single lines but by an area like a QCPItemText or the bars of a QCPBars plottable, a click inside the area should also be considered a hit. In these cases this function thus returns a constant value greater zero but still below the parent plot's selection tolerance. (typically the selectionTolerance multiplied by 0.99).
Providing a constant value for area objects allows selecting line objects even when they are obscured by such area objects, by clicking close to the lines (i.e. closer than 0.99*selectionTolerance).
The actual setting of the selection state is not done by this function. This is handled by the parent QCustomPlot when the mouseReleaseEvent occurs, and the finally selected object is notified via the selectEvent/deselectEvent methods.
details is an optional output parameter. Every layerable subclass may place any information in details. This information will be passed to selectEvent when the parent QCustomPlot decides on the basis of this selectTest call, that the object was successfully selected. The subsequent call to selectEvent will carry the details. This is useful for multi-part objects (like QCPAxis). This way, a possibly complex calculation to decide which part was clicked is only done once in selectTest. The result (i.e. the actually clicked part) can then be placed in details. So in the subsequent selectEvent, the decision which part was selected doesn't have to be done a second time for a single selection operation.
You may pass 0 as details to indicate that you are not interested in those selection details.
Implements QCPAbstractPlottable.
Definition at line 14978 of file qcustomplot.cpp.
References mData, QCPAbstractPlottable::mKeyAxis, QCPAbstractPlottable::mSelectable, QCPAbstractPlottable::mValueAxis, and pointDistance().
| void setAdaptiveSampling | ( | bool | enabled | ) |
Sets whether adaptive sampling shall be used when plotting this graph. QCustomPlot's adaptive sampling technique can drastically improve the replot performance for graphs with a larger number of points (e.g. above 10,000), without notably changing the appearance of the graph.
By default, adaptive sampling is enabled. Even if enabled, QCustomPlot decides whether adaptive sampling shall actually be used on a per-graph basis. So leaving adaptive sampling enabled has no disadvantage in almost all cases.

As can be seen, line plots experience no visual degradation from adaptive sampling. Outliers are reproduced reliably, as well as the overall shape of the data set. The replot time reduces dramatically though. This allows QCustomPlot to display large amounts of data in realtime.

Care must be taken when using high-density scatter plots in combination with adaptive sampling. The adaptive sampling algorithm treats scatter plots more carefully than line plots which still gives a significant reduction of replot times, but not quite as much as for line plots. This is because scatter plots inherently need more data points to be preserved in order to still resemble the original, non-adaptive-sampling plot. As shown above, the results still aren't quite identical, as banding occurs for the outer data points. This is in fact intentional, such that the boundaries of the data cloud stay visible to the viewer. How strong the banding appears, depends on the point density, i.e. the number of points in the plot.
For some situations with scatter plots it might thus be desirable to manually turn adaptive sampling off. For example, when saving the plot to disk. This can be achieved by setting enabled to false before issuing a command like QCustomPlot::savePng, and setting enabled back to true afterwards.
Definition at line 14849 of file qcustomplot.cpp.
References mAdaptiveSampling.
Referenced by QCPGraph().
| void setChannelFillGraph | ( | QCPGraph * | targetGraph | ) |
Sets the target graph for filling the area between this graph and targetGraph with the current brush (setBrush).
When targetGraph is set to 0, a normal graph fill to the zero-value-line will be shown. To disable any filling, set the brush to Qt::NoBrush.
Definition at line 14798 of file qcustomplot.cpp.
References mChannelFillGraph, and QCPLayerable::mParentPlot.
Referenced by QCPGraph().
| void setData | ( | QCPDataMap * | data, |
| bool | copy = false |
||
| ) |
Replaces the current data with the provided data.
If copy is set to true, data points in data will only be copied. if false, the graph takes ownership of the passed data and replaces the internal data pointer with it. This is significantly faster than copying for large datasets.
Alternatively, you can also access and modify the graph's data via the data method, which returns a pointer to the internal QCPDataMap.
Definition at line 14517 of file qcustomplot.cpp.
Referenced by MainWindow::UpdateSummary().
| void setData | ( | const QVector< double > & | key, |
| const QVector< double > & | value | ||
| ) |
This is an overloaded member function, provided for convenience. It differs from the above function only in what argument(s) it accepts.
Replaces the current data with the provided points in key and value pairs. The provided vectors should have equal length. Else, the number of added points will be the size of the smallest vector.
Definition at line 14540 of file qcustomplot.cpp.
References QCPData::key, and mData.
| void setDataBothError | ( | const QVector< double > & | key, |
| const QVector< double > & | value, | ||
| const QVector< double > & | keyError, | ||
| const QVector< double > & | valueError | ||
| ) |
Replaces the current data with the provided points in key and value pairs. Additionally the symmetrical key and value errors of the data points are set to the values in keyError and valueError. For error bars to show appropriately, see setErrorType. The provided vectors should have equal length. Else, the number of added points will be the size of the smallest vector.
For asymmetrical errors (plus different from minus), see the overloaded version of this function.
Definition at line 14669 of file qcustomplot.cpp.
References QCPData::key, and mData.
| void setDataBothError | ( | const QVector< double > & | key, |
| const QVector< double > & | value, | ||
| const QVector< double > & | keyErrorMinus, | ||
| const QVector< double > & | keyErrorPlus, | ||
| const QVector< double > & | valueErrorMinus, | ||
| const QVector< double > & | valueErrorPlus | ||
| ) |
This is an overloaded member function, provided for convenience. It differs from the above function only in what argument(s) it accepts. Replaces the current data with the provided points in key and value pairs. Additionally the negative key and value errors of the data points are set to the values in keyErrorMinus and valueErrorMinus. The positive key and value errors are set to the values in keyErrorPlus valueErrorPlus. For error bars to show appropriately, see setErrorType. The provided vectors should have equal length. Else, the number of added points will be the size of the smallest vector.
Definition at line 14698 of file qcustomplot.cpp.
References QCPData::key, and mData.
| void setDataKeyError | ( | const QVector< double > & | key, |
| const QVector< double > & | value, | ||
| const QVector< double > & | keyError | ||
| ) |
Replaces the current data with the provided points in key and value pairs. Additionally the symmetrical key error of the data points are set to the values in keyError. For error bars to show appropriately, see setErrorType. The provided vectors should have equal length. Else, the number of added points will be the size of the smallest vector.
For asymmetrical errors (plus different from minus), see the overloaded version of this function.
Definition at line 14616 of file qcustomplot.cpp.
References QCPData::key, and mData.
| void setDataKeyError | ( | const QVector< double > & | key, |
| const QVector< double > & | value, | ||
| const QVector< double > & | keyErrorMinus, | ||
| const QVector< double > & | keyErrorPlus | ||
| ) |
This is an overloaded member function, provided for convenience. It differs from the above function only in what argument(s) it accepts. Replaces the current data with the provided points in key and value pairs. Additionally the negative key error of the data points are set to the values in keyErrorMinus, the positive key error to keyErrorPlus. For error bars to show appropriately, see setErrorType. The provided vectors should have equal length. Else, the number of added points will be the size of the smallest vector.
Definition at line 14642 of file qcustomplot.cpp.
References QCPData::key, and mData.
| void setDataValueError | ( | const QVector< double > & | key, |
| const QVector< double > & | value, | ||
| const QVector< double > & | valueError | ||
| ) |
Replaces the current data with the provided points in key and value pairs. Additionally the symmetrical value error of the data points are set to the values in valueError. For error bars to show appropriately, see setErrorType. The provided vectors should have equal length. Else, the number of added points will be the size of the smallest vector.
For asymmetrical errors (plus different from minus), see the overloaded version of this function.
Definition at line 14563 of file qcustomplot.cpp.
References QCPData::key, and mData.
| void setDataValueError | ( | const QVector< double > & | key, |
| const QVector< double > & | value, | ||
| const QVector< double > & | valueErrorMinus, | ||
| const QVector< double > & | valueErrorPlus | ||
| ) |
This is an overloaded member function, provided for convenience. It differs from the above function only in what argument(s) it accepts. Replaces the current data with the provided points in key and value pairs. Additionally the negative value error of the data points are set to the values in valueErrorMinus, the positive value error to valueErrorPlus. For error bars to show appropriately, see setErrorType. The provided vectors should have equal length. Else, the number of added points will be the size of the smallest vector.
Definition at line 14589 of file qcustomplot.cpp.
References QCPData::key, and mData.
| void setErrorBarSize | ( | double | size | ) |
Sets the width of the handles at both ends of an error bar in pixels.
Definition at line 14768 of file qcustomplot.cpp.
References mErrorBarSize.
Referenced by QCPGraph().
| void setErrorBarSkipSymbol | ( | bool | enabled | ) |
If enabled is set to true, the error bar will not be drawn as a solid line under the scatter symbol but leave some free space around the symbol.
This feature uses the current scatter size (QCPScatterStyle::setSize) to determine the size of the area to leave blank. So when drawing Pixmaps as scatter points (QCPScatterStyle::ssPixmap), the scatter size must be set manually to a value corresponding to the size of the Pixmap, if the error bars should leave gaps to its boundaries.
setErrorType, setErrorBarSize, setScatterStyle
Definition at line 14784 of file qcustomplot.cpp.
References mErrorBarSkipSymbol.
Referenced by QCPGraph().
| void setErrorPen | ( | const QPen & | pen | ) |
Sets the pen with which the error bars will be drawn.
Definition at line 14760 of file qcustomplot.cpp.
References mErrorPen, and QCPAbstractPlottable::pen().
Referenced by QCPGraph().
| void setErrorType | ( | ErrorType | errorType | ) |
Sets which kind of error bars (Key Error, Value Error or both) should be drawn on each data point. If you set errorType to something other than etNone, make sure to actually pass error data via the specific setData functions along with the data points (e.g. setDataValueError, setDataKeyError, setDataBothError).
Definition at line 14751 of file qcustomplot.cpp.
References errorType(), and mErrorType.
Referenced by QCPGraph().
| void setLineStyle | ( | LineStyle | ls | ) |
Sets how the single data points are connected in the plot. For scatter-only plots, set ls to lsNone and setScatterStyle to the desired scatter style.
Definition at line 14727 of file qcustomplot.cpp.
References mLineStyle.
Referenced by QCPGraph().
| void setScatterStyle | ( | const QCPScatterStyle & | style | ) |
Sets the visual appearance of single data points in the plot. If set to QCPScatterStyle::ssNone, no scatter points are drawn (e.g. for line-only-plots with appropriate line style).
Definition at line 14738 of file qcustomplot.cpp.
References mScatterStyle.
|
protected |
Definition at line 16130 of file qcustomplot.cpp.
References QCPAxis::atBottom, QCPAxis::atLeft, QCPAxis::atRight, QCPAxis::atTop, QCPAxis::axisRect(), QCPAxis::axisType(), QCPAxisRect::bottom(), QCPAxis::coordToPixel(), QCPAbstractPlottable::keyAxis(), QCPAxisRect::left(), QCPAbstractPlottable::mKeyAxis, QCPAbstractPlottable::mValueAxis, QCPAxis::orientation(), QCPAxis::range(), QCPAxis::rangeReversed(), QCPAxisRect::right(), QCPAxis::scaleType(), QCPAxis::stLinear, QCPAxisRect::top(), QCPRange::upper, and QCPAbstractPlottable::valueAxis().
Referenced by addFillBasePoints().
|
friend |
Definition at line 2630 of file qcustomplot.h.
|
friend |
Definition at line 2629 of file qcustomplot.h.
|
protected |
Definition at line 2590 of file qcustomplot.h.
Referenced by getPreparedData(), and setAdaptiveSampling().
|
protected |
Definition at line 2589 of file qcustomplot.h.
Referenced by drawFill(), getChannelFillPolygon(), and setChannelFillGraph().
|
protected |
Definition at line 2582 of file qcustomplot.h.
Referenced by addData(), clearData(), countDataInBounds(), draw(), getKeyRange(), getPreparedData(), getValueRange(), getVisibleDataBounds(), pointDistance(), QCPGraph(), removeData(), removeDataAfter(), removeDataBefore(), rescaleKeyAxis(), rescaleValueAxis(), selectTest(), setData(), setDataBothError(), setDataKeyError(), setDataValueError(), and ~QCPGraph().
|
protected |
Definition at line 2587 of file qcustomplot.h.
Referenced by drawError(), and setErrorBarSize().
|
protected |
Definition at line 2588 of file qcustomplot.h.
Referenced by drawError(), and setErrorBarSkipSymbol().
|
protected |
Definition at line 2583 of file qcustomplot.h.
Referenced by drawScatterPlot(), and setErrorPen().
|
protected |
Definition at line 2586 of file qcustomplot.h.
Referenced by drawError(), drawScatterPlot(), and setErrorType().
|
protected |
Definition at line 2584 of file qcustomplot.h.
Referenced by draw(), drawFill(), drawLegendIcon(), getPlotData(), pointDistance(), and setLineStyle().
|
protected |
Definition at line 2585 of file qcustomplot.h.
Referenced by draw(), drawError(), drawLegendIcon(), drawScatterPlot(), pointDistance(), and setScatterStyle().
 1.8.5
1.8.5